The participants are required to face exactly the same task of the ICIP 2013 Contest (also using the same training and testing dataset) namely to design and implement a pattern recognition system able to classify the cells belonging to HEp-2 images in one of the following pattern classes: homogeneous, speckled, nucleolar, centromere, golgi and nuclear membrane.
Classes of staining patterns
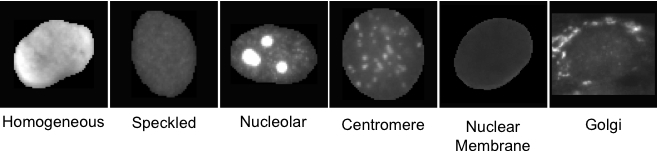
- homogeneous : a uniform diffuse fluorescence covering the entire nucleoplasm sometimes accentuated in the nuclear periphery
-
speckled
: these patterns have two sub-categories:
- coarse speckled : densely distributed, variously sized speckles, generally associated with larger speckles, throughout nucleoplasm of interphase cells; nucleoli are negative
- fine speckled : fine speckled staining in a uniform distribution, sometimes very dense so that an almost homogeneous pattern is attained; nucleoli may be positive or negative
- nucleolar : brightly clustered large granules corresponding to decoration of the fibrillar centers of the nucleoli as well as the coiled bodies
- centromere : rather uniform discrete speckles located throughout the entire nucleus
- golgi : staining of a polar organelle adjacent to and paratly surrounding the nucleus, composed of irregular large granules. Nuclei and nucleoli are negative. Diffuse staining of the cytoplasm of dividing cells sometimes with accentuation around chromosomal material
- nuclear membrane : a smooth homogeneous ring-like fluorescence of the nuclear membrane in interphase cells
Dataset description
The dataset has been collected between 2011 and 2013 at Sullivan Nicolaides Pathology laboratory, Australia. It utilizes 419 patient positive sera, which were prepared on the 18-well slide of HEP-2 IIF assay from Immuno Concepts N.A. Ltd. with screening dilution 1:80. The specimens were then automatically photographed using a monochrome high dynamic range cooled microscopy camera which was fitted on a microscope with a plan-Apochromat 20x/0.8 objective lens and an LED illumination source. Approximately 100-200 cell images were extracted from each patient serum. In total there were 68,429 cell images extracted: 13,596 images used for training, made available to the teams, and 54,833 for testing, privately mantained by the organizers. The specimen images from the ICPR2014 dataset were automatically segmented by using the DAPI channel and manually annotated by specialists
The labeling process involved at least two scientists who read each patient specimen under a microscope. A third expert’s opinion was sought to adjudicate any discrepancy between the two opinions. We used each specimen label for the ground-truth of cells extracted from it. Furthermore, all the labels were validated by using secondary tests such as ENA and anti-ds-DNA in order to confirm the presence and/absence of specific patterns.
Each cell image contained in the database is annotated with the following information:
- Cell pattern (one of the patterns defined above)
- Cell intensity
- Cell mask
- ID of the image which the cell belongs to
Evaluation
The application obtaining the highest value of the mean class accuracy in cell classification over the test set will be declared as the winner only if the performance of the best team will be higher than the performance of the winner of the ICIP 2013 edition of the competition under the new metric (i.e. 81.22). The proclamation of the winners will be made during the contest session at ICPR 2014. The contest session will be held as one of the sessions of the I3A Workshop.